
 Weekly Update from RLA Tax and Wealth Advisory
By: Dennis Tubbergen
So What Is Behind Silver’s Huge Upward Move?
I’m changing up the normal “Portfolio Watch” format this week to talk about the current dynamics of the silver market.
I’ve had recent conversations with clients and subscribers who are wondering about taking profits here.
Let me first begin by saying, as I often do, that my crystal ball doesn’t work. While I practice technical analysis of markets and absorb as much research as waking hours and attention span permit, my research and forecasts, like any other, are not perfect.
That said, let’s begin with the technical side of the silver market. If you’re not familiar with technical analysis, it’s the study of market data like price movement, trading volume, and price levels relative to long-term average prices. Often, this technical data forms a pattern that is very predictable (although never 100%). This predictability of market patterns exists because human behavior is predictable.
While there have been literally thousands of books written on the topics of technical analysis and trading systems, in the interest of brevity, let me share one pattern with you that has been a historically reliable bullish pattern. It’s called a cup and handle pattern.
Typically, the longer it takes for this pattern to form, the more powerful the bullish move that follows. Observe the chart below illustrating silver prices going back to 1975.
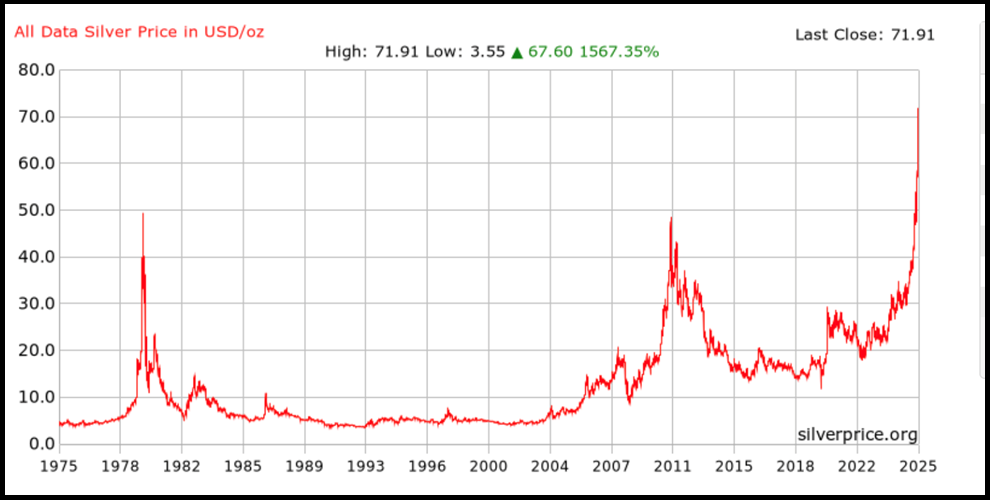
The cup and handle pattern is obvious. The blue line on the chart is the top of the cup. The green line on the chart is the cup handle. Note how the silver price recently broke out from the handle part of the chart pattern. Also, take note of the fact that this chart pattern took more than 45 years to form, making this breakout potentially extremely powerful.
Then there are the fundamentals of the silver market.
While there is more to this story than what I have the ability to discuss here due to space limitations, let me give you the two fundamental factors that I deem to be most important.
One, presently, there is a notable price arbitrage between Eastern silver markets and US markets. On December 24, silver prices rose to $78.55 per ounce on the Shanghai Gold Exchange (Source: https://news.bitcoin.com/silver-prices-surge-in-shanghai-amid-backwardation-signaling-tight-supply-in-china/) while silver prices in the United States on the Comex market closed at $72.36 per ounce.
In today’s world, such a price arbitrage is literally never seen and reveals that silver supplies in China are running increasingly short, a fact that I reported here recently.
Two, a lot of the gold for sale on Comex has been taken off the market as noted from the chart.
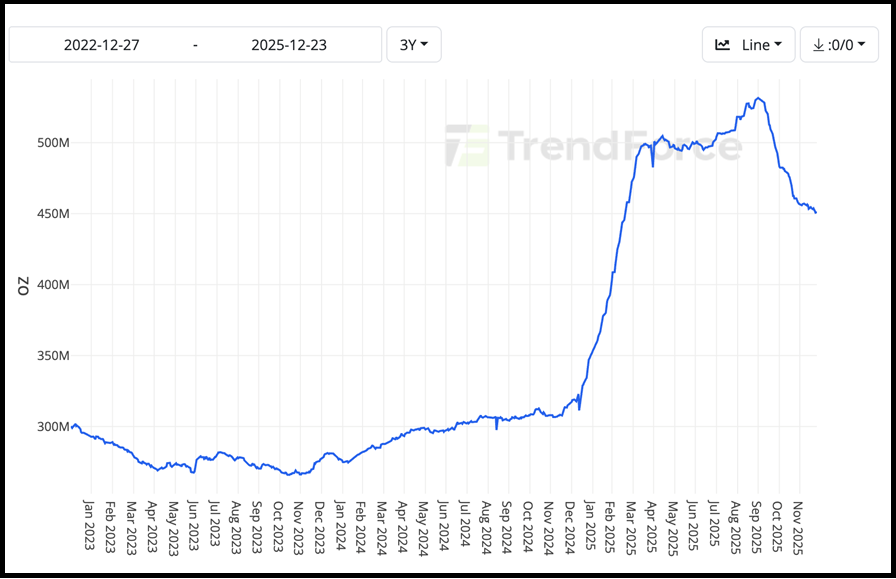
This chart illustrates Comex silver inventories through last week (Source: https://datatrack.trendforce.com/Chart/content/1545/comex-inventory-silver). Notice that as silver prices have rocketed higher, inventories are declining.
If there was profit taking in the silver market, one would expect that silver inventoried would be expanding, not contracting. This chart tells me that there is more buying demand in silver than offers to sell.
When reviewing the open interest in silver futures contracts on Comex, there is more open interest as we close this year than at any time since December of 2012.
This tells me that despite the recent monster gains in silver, there may be more upside ahead.
If you already own silver, I’d consider holding it with an eye on a sell stop. If you’re looking to speculate, there may be some more upside here.
RLA Radio
The RLA radio program this week features some of my economic and investing forecasts for 2026. Listen now by clicking on the "Podcast" tab at the top of this page and discover how to get a written copy of my 2026 forecasts.
Quote of the Week
“Saving is a fine thing. Especially when your parents have done it for you.”
-Sir Winston Churchill

Comments