 Weekly Update from RLA Tax and Wealth Advisory

By: Dennis Tubbergen
My Stagflation Forecast Updated
Stagflation is defined as rising consumer prices combined with a contracting economy.
Suppose you’ve been a long-term reader of this publication. In that case, you know that I have forecast that we would ultimately move to stagflation as an already weak US economy weakens further and inflation accelerates as additional easy money policies are use to try to resurrect the economy.
Contrary to what many analysts and prognosticators are saying, inflation has not gone away.
In last week’s “Portfolio Watch”, I reported that producer price inflation accelerated significantly during the month of July, rising .9% month-over-month – a simply huge number.
This week, another statistic emerged that speaks to the strength of the US economy.
That statistic is corporate bankruptcies. Corporate bankruptcies hit a 14-year high in 2024, and the pace of corporate bankruptcies has continued through the first seven months of 2025. (Source: https://www.moneymetals.com/news/2025/08/21/july-corporate-bankruptcies-hit-highest-level-since-2010-004282)
In July, there were 71 corporate bankruptcy filings, up from 66 filings during the month of June. Through the first seven months of 2025, there have been 446 corporate bankruptcy filings, the most for any seven-month period since 2010 during the Great Recession.
Seems that the Federal Reserve’s next move will be to cut interest rates as political pressure mounts to do so, which will almost certainly continue to fuel inflation.
Condo Prices Continue to Slide
As long-time readers of “Portfolio Watch” will recognize, I have been suggesting that as the stagflationary environment comes into existence, we would see the price of risk assets like real estate and stocks fall.
That also seems to be beginning, especially as it relates to condominiums. Wolf Richter reported this past week that the price of condos has fallen from 12% to 26% in 21 larger markets in the United States through July. (Source: https://wolfstreet.com/2025/08/20/condo-prices-already-dropped-by-12-26-in-21-bigger-cities-through-july-condo-bust-takes-shape/)
Of course, this price decline is not surprising, nor is it unexpected. When prices of any asset increase at an unsustainable rate, as real estate prices in many markets have, prices revert to the mean.
That’s what is happening now. After a period of time that saw real estate and condo prices rocket higher, fueled by easy money and artificially low interest rates, mean reversion is now occurring.
From calendar year 2020 to 2022, condo prices in many markets like Naples, Phoenix, and Mesa surged higher by 50% to 70%. Price increases of that magnitude over that short time frame are unsustainable, which current, corrective price action confirms.
From the peak, condo prices in Oakland, California, are down 26% from the peak. Oakland is leading the country in percentage price declines, but is followed closely by Austin, Texas, at 24%, St. Petersburg, FL, at 23%, Ft Myers, FL, at 19% and Sarasota, FL, at 19%.
The condo price bust is clearly underway. I fully expect the rest of the real estate market to follow suit.
Stocks to Follow Real Estate?
One way to measure the value of stocks is to examine the price-to-earnings ratio of a major stock index like the Standard and Poor’s 500.
If you’re not familiar with the price to earnings ratio, it’s an easy way for an investor to determine it stocks are ‘expensive’ or ‘cheap’. The ratio takes the price of the stock per share in dollars and divides it by the earnings of the company per share of stock in dollars.
A stock that sells for $10 per share and has earnings per share of $1 has a price to earnings ratio of 10, while a stock that sells for $20 per share with $1 in earnings has a price to earnings ratio of 20.
 In the former case, an investor would have to invest $10 to get $1 in earnings, while in the latter case, an investor would be required to invest $20 to get the same $1 in earnings. Admittedly, this analysis works best for blue chip type stocks rather than growth stocks.
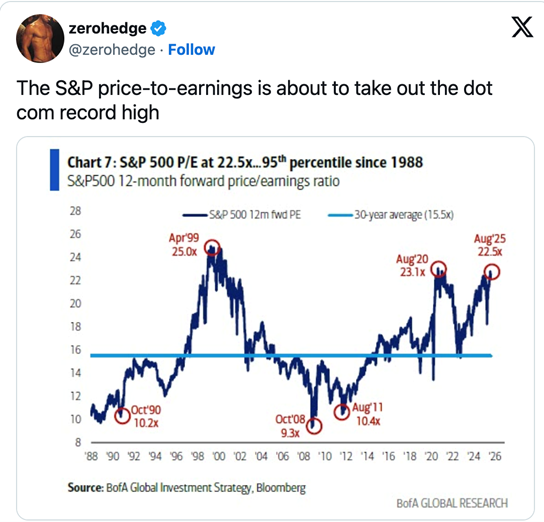
When looking at the Standard and Poor’s 500 collectively, the current price to earnings ratio is 22.5. (Source: https://marketsanity.com/the-sp-price-to-earnings-is-about-to-take-out-the-dot-com-record-high/). For perspective, note the blue line on the chart that shows the 30-year average price-to-earnings ratio is 15.5. The current price-to-earnings ratio is 45% higher than the average level over the past 30 years.
For additional perspective, the all-time high price-to-earnings ratio was 25 just prior to the tech stock bubble meltdown in 1999. We are once again approaching those levels.
From where I sit, it seems that my stagflation forecast will be on target. The signs are now appearing.
If you haven’t yet done so, you should take steps now to protect yourself and potentially profit.
RLA Radio
The RLA radio program this week features an interview that I conducted with Mr. Brien Lundin, host of the largest investment conference in the world, The New Orleans Investment Conference.
Mr. Lundin is also the publisher of Gold Newsletter, the oldest gold newsletter in the country, dating back to 1971 when the US Dollar became a fiat currency.
The interview is posted and available now by clicking on the "Podcast" tab at the top of this page.
Quote of the Week
“There is no problem that can’t be solved if you break it down into small enough pieces.”
-Henry Ford


Comments